
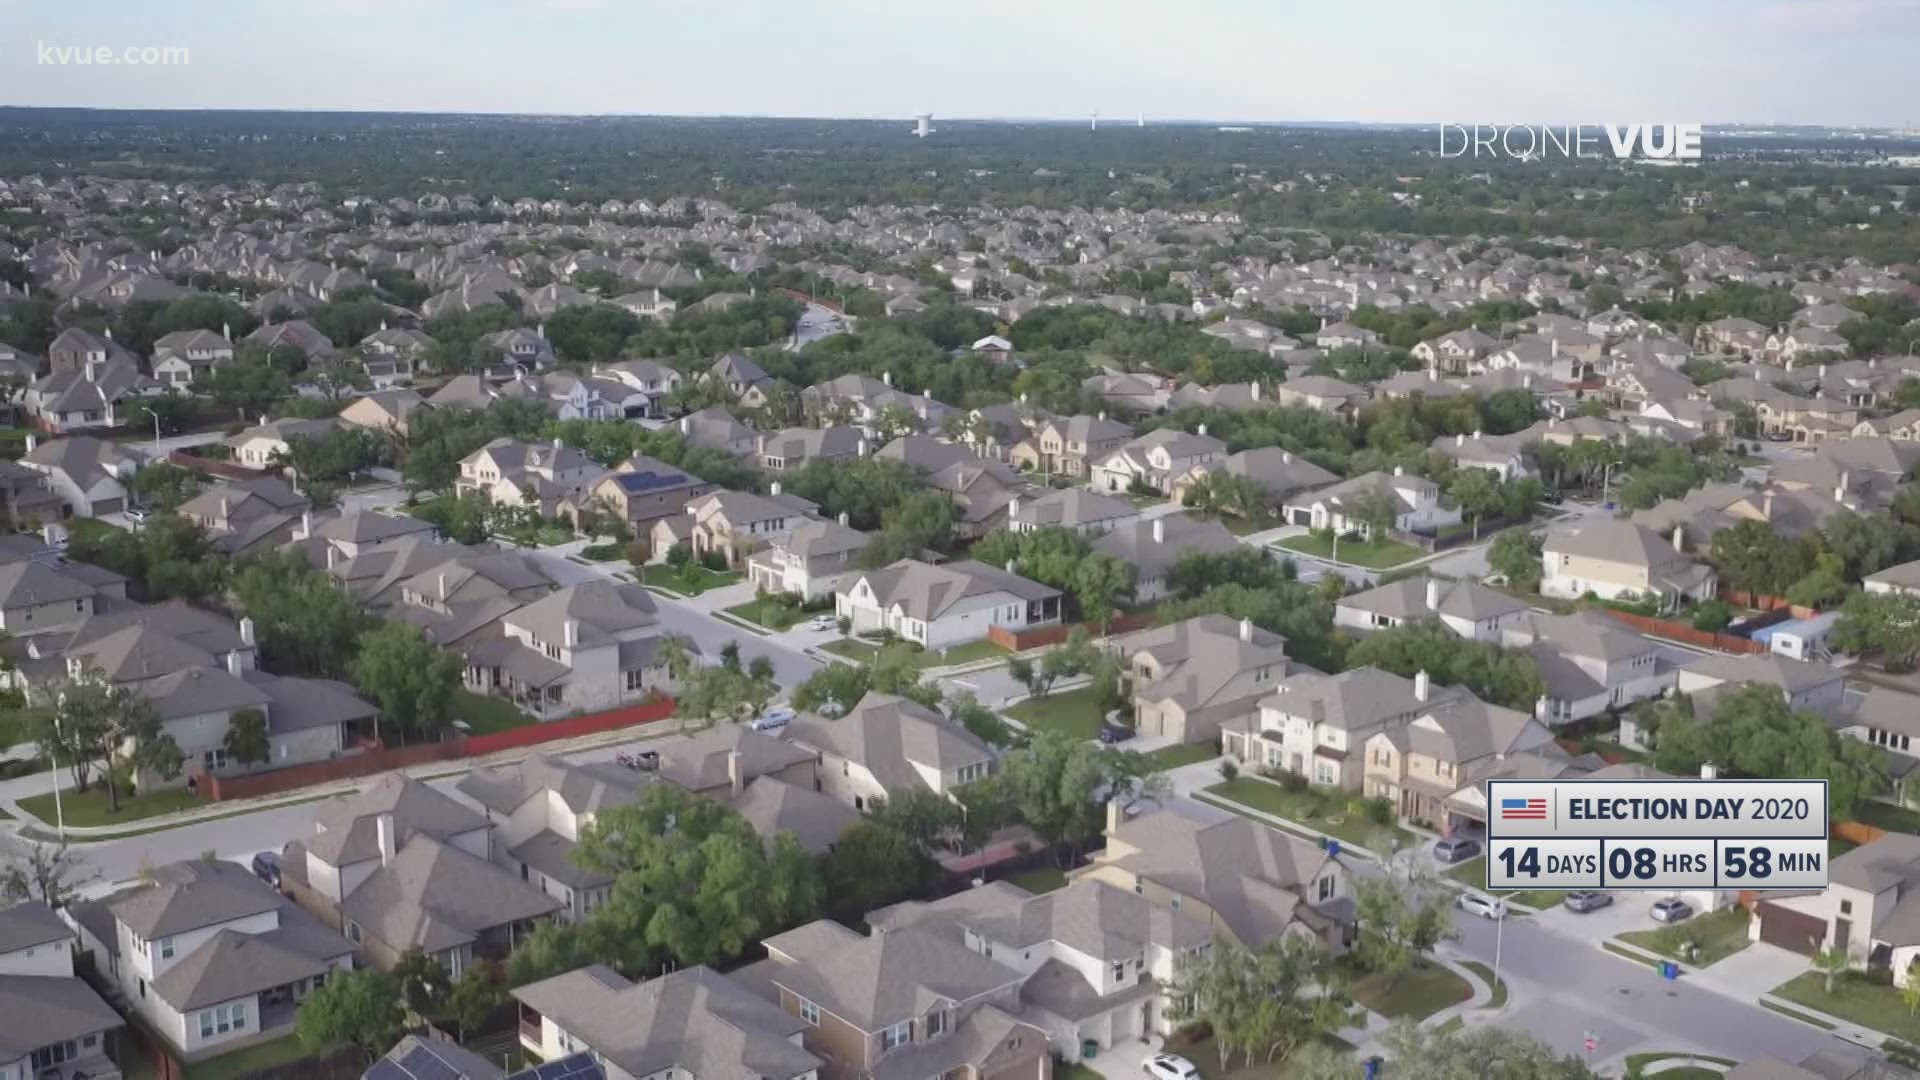
WILLIAMSON COUNTY, Texas — Williamson County's population is growing annually, and that growth is contributing to a change in the county's voter demographics.
In about a decade, the county's population has grown by nearly 40%, from 422,679 to 590,551, according to U.S. Census Bureau estimates.
Depending on who you ask, this growth is either good or bad.
"I have lived here since 2011, and this certainly isn't the Williamson County that I knew when I first moved here," Williamson County Democratic Party Chair Kim Gilby said. "The times are changing. The demographics are changing. And it's a great place to be, in WilCo, now."
Gilby has helped lead the effort to try to turn the historically conservative county blue.
In 2018, for example, Williamson County Democrats voted to elect MJ Hegar, then-candidate for the U.S. House of Representatives - District 31, and Beto O'Rourke, then-candidate for U.S. Senate, although neither won their election.
But the Democrats did flip two Texas House of Representatives seats.
Democrat James Talarico narrowly defeated Republican Cynthia Flores for State Representative for District 52 (Round Rock). And Democrat John Bucy III defeated incumbent Republican Tony Dale for State Representative for District 136 (Leander, Cedar Park) by several thousand votes.
Gilby said they plan to do more this election.
"We not only plan to keep those two seats, we plan to elect a Democratic sheriff here in WilCo, take a seat or two on the bench and elect Democrats up and down the ballot," she said.
But Williamson County Judge Bill Gravell, a Republican, said the county's Republican voters are just as energized as its Democrats.
"If you think that the Republican Party is going anywhere anytime soon, you're sadly mistaken," Gravell said.
In 2016, then-candidate Donald Trump received more than 104,000 votes in Williamson County. Hillary Clinton received nearly 20,000 fewer votes.
Gravell expects to see similar results this election.
"I've seen the Beto tsunami. I think we're going to see a Trump tsunami, too. And I'm just not trying to be political. I'm just being honest with you. There is a wave of folks coming out this year that I've not seen before," he said.
Still, Gilby remains optimistic.
"I think a lot of people that usually are complacent on our side, they're awake. They are voting. Not only are they voting, they're volunteering. They're donating," she said. "We're going to stay focused. We're going to do the work. We're going to get out our voters. We're going to win this."
Williamson County Republican Party Chair Steve Armbruster wasn't available to speak with KVUE Monday, but he sent the following statement:
"The demographics of Williamson County are changing. People are fleeing high tax and high regulation states like California, Illinois and New York. People are also being priced out of their homes in Austin due to the excessive tax and spend policies of Travis County and the City of Austin. These people are looking for a cost effective place to live that is also a great place to live, work and raise a family. Williamson County is that great place to live, work and raise a family due to the conservative leadership that we have had here for more than 3 decades, and I am certain that with good conservative leadership into the future, Williamson County will remain a great place to live, work and raise a family."
Below is a breakdown of some important recent Democratic and Republican votes in Williamson County that help paint a picture of its changing dynamics.
- 2008 straight ticket:
Republican: 46,599 (59.77%)
Democrat: 30,488 (39.11%) - 2008 president and vice president:
John McCain/Sarah Palin: 88,323 (55.49%)
Barack Obama/Joe Biden: 67,691 (42.53%) - 2012 straight ticket:
Republican: 52,341 (63.26%)
Democrat: 29,115 (35.19%) - 2012 president and vice president:
Mitt Romney/Paul Ryan: 97,006 (59.22%)
Barack Obama/Joe Biden: 61,875 (37.77%) - 2016 straight ticket:
Republican: 66,610 (56.93%)
Democrat: 47,379 (40.49%) - 2016 president and vice president:
Donald Trump/Mike Pence: 104,175 (50.90%)
Hillary Clinton/Tim Kaine: 84,468 (41.27%)
PEOPLE ARE ALSO READING: